Using the Blackmagic debug probe (BMP) with Netbeans is very similar when doing the same but with using Openocd.
The initial steps are the same to use the BMP probe and Openocd. First we set up the ARM toolchain or other, as needed. We also need the gdbserver plugin for Netbeans, and so, we also need to install it. After these two initial steps, the remaining configuration and how to use the probe differs a bit differently from when using Openocd.
One of the main differences is that with Openocd, externally we launch an instance of Openocd and then use the Netbeans gdbserver plugin to connect to that openocd instance. For that we use the Netbeans menu Debug and Attach Debugger and use connection string extended-remote localhost:3333 and the selected project:

For using the BMP probe we don’t need no intermediary software since the code supporting the gdbserver plugin is already on the probe firmware, which means that the debugger can connect directly to the target. In fact due to this we do not need now to attach to a debugger and we can start using the Debug Project (CTRL-F5) to program/flash the code output (optional) and to start debugging the code running on the target device.
For this to happen we need to configure the Debug Command for the project (this must be done for each project if needed) and if wanted we can also configure the Run Command.
Before we are able to do that, we need first to create a command file for the gdb debugger that will pre-execute some commands, namely to attach to the targets probe, before starting the debugging session.
For that I’ve created a file named BMPgdbinit located, in my case, in /opt/ARM:
target extended-remote /dev/ttyACM0
monitor swdp_scan
att 1
load
start
run
This file is invoked by the ARM debugger toolchain (like this: arm-none-eabi-gdb -x /opt/ARM/BMPgdbinit file.out) and it will connect to the Blackmagic probe, that should be located at /dev/ttyACM0, scan the SWD searching for the device, attaches to it, loads/programs the output file, namely the firmware, and starts it. From this point the gdbserver from Netbeans takes control and should stop at the first line of code or the first break point.
So to configure the run command we edit the Project Properties and modify the Run command:
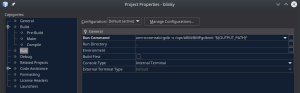
Just define the Run Command as arm-none-eabi-gdb -x /opt/ARM/BMPgdbinit “${OUTPUT_PATH}”
With this configuration we can now press F6 to flash our firmware (because the load command is on the BMPgdbinit file) and run it.
For debugging we need the following configuration:

We must define the Debug Command as ${OUTPUT_PATH} since this will be passed as the arm-none-eabi-gdb file parameter.
We also need to point to the correct location of the BMPgdbinit file.
We can now just press CTRL-F5 to launch a debug session, and again, the firmware will be loaded, and the code will stop at the first break point.
An example of using Netbeans to build a simple program targeting the nRF52832 (the blinky example from pcbreflux ) with an added variable and a watch point set:

That’s it….
Issues:
There are some issues with the above process…
Can’t stop the debugger. Pressing Pause does nothing…
This is a long standing bug apparently so the solution is on a external terminal window send a SIGINT signal to the gdb process:
[pcortex@pcortex:~]$ ps -ef | grep arm-none
pcortex 9792  9405  0 20:22 ?        00:00:00 /tmp/dlight_fdam/5fe1c993/0397644155/pty --dir /opt/nordic/nRF52832/blinky --no-pty /opt/ARM/gcc-arm-none-eabi-6_2-2016q4/bin/arm-none-eabi-gdb -x /opt/ARM/BMPgdbinit -nx --interpreter mi -tty /dev/pts/7
pcortex 9794  9792  0 20:22 ttyACM0  00:00:00 /opt/ARM/gcc-arm-none-eabi-6_2-2016q4/bin/arm-none-eabi-gdb -x /opt/ARM/BMPgdbinit -nx --interpreter mi -tty /dev/pts/7
Just send a SIGINT signal to the process associated to the Blackmagic probe:
kill -SIGINT 9794
The control is returned to Netbeans.
The debugger doesn’t seem to follow my code…
Just Clean and build all the project and select run so a clean version of the program is flashed.
I unplug and plug the probe a lot and the tty ports change..
Because of this the BMPgdbinit script can be broken because the probe port changes, for example, to /dev/ttyACM2.
The solution is to create a rules file:
Mine, for Arch Linux is as follows:
# Black Magic Probe
# there are two connections, one for GDB and one for uart debugging
  SUBSYSTEM=="tty", ATTRS{interface}=="Black Magic GDB Server", SYMLINK+="ttyBMP"
  SUBSYSTEM=="tty", ATTRS{interface}=="Black Magic UART Port", SYMLINK+="ttyBMPUART"
This file is named 99-blackmagic.rules located at /etc/udev/rules.d.
We now need to change the port used on the BMPgdbinit file from /dev/ttyACM0 to /dev/ttyBMP. Note that after plugging in the probe to the USB port, it takes a while (2 to 3 seconds) to the ports appear.
This just doesn’t work…
Yes, some times the behaviour seems strange… I’ve worked around some of the issues by flashing again the softdevice and the program mannually from the GDB command line.
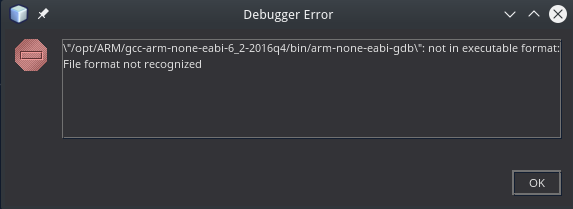
Also if something like this happens:

It is due to the fact that the Netbeans environment variables $OUTPUT_PATH is empty… The solution is to explicitly state the outputfile on the RUN and Debug commands instead of using the ENV var. For example change this:
arm-none-eabi-gdb -x /opt/ARM/BMPgdbinit "${OUTPUT_PATH}"
to this
arm-none-eabi-gdb -x /opt/ARM/BMPgdbinit /opt/Projects/nRF/proj1/program.out
or to this:
arm-none-eabi-gdb -x /opt/ARM/BMPgdbinit "${PROJECT_DIR}/file.out"
Final note:
As a final note, some other errors might creep up like:
- Program is not being run: Check the command line of arm-none-eabi-gdb to see if the BMPgdbinit file is correctly provided.
- Don’t know how to run. Try \”help target\”.: Same issue. Check if the run and debug commands are correctly defined.
- Sometimes my target isn’t detected.: Adding an extra monitor swdp_scan line to the BMPgdbinit file might help.